Gantt chart is a timeline, which represents graphically the time that you have from the beginning according to the work that you need to do for your project. It is helpful and also necessary to have such a planning for most of the project. With Gantt chart you can manage your time and your group to start and finish your project in time. Respecting the submitting deadlines help to get the best result in the time that you have [1].
Here from the beginning to the final submission, I had two weeks. According to the project and time, I tried to break my time and make my Gantt chart as you can see here.
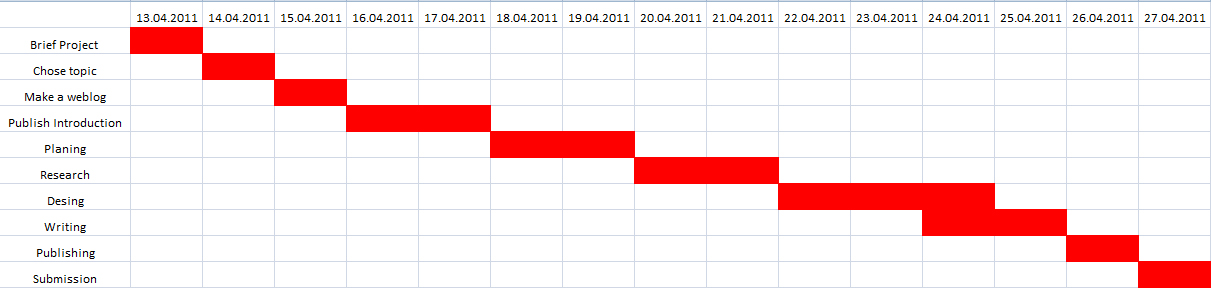
Gantt chart for “Drama and Acting” website project – Picture 1
No comments:
Post a Comment